
What Are the Benefits of Using a Fib Retracement Scanner in Chrome?
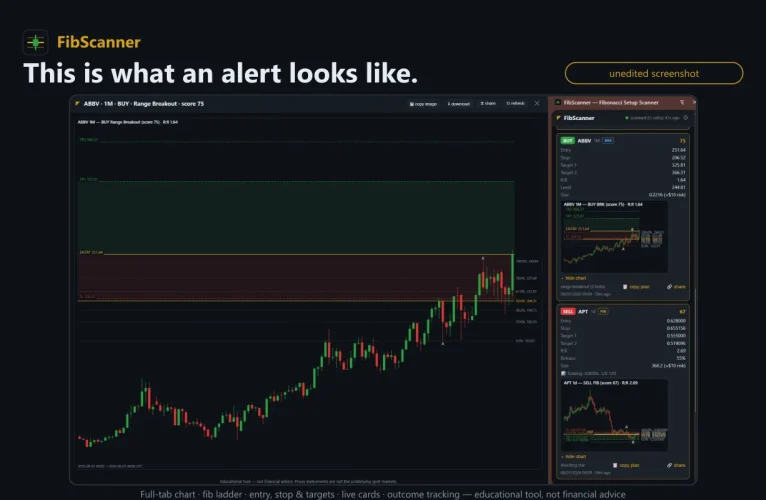
A Fib retracement scanner Chrome tool helps traders identify potential Fibonacci retracement levels directly from their browser. Instead of manually drawing Fibonacci levels on every chart, a scanner can analyze price movements and highlight areas where a market may react.
Fibonacci retracement levels commonly include 23.6%, 38.2%, 50%, 61.8%, and 78.6%. Traders use these levels to identify possible support, resistance, pullback, and continuation zones.
A Chrome-based scanner makes this process faster because traders can access market analysis without constantly switching between different applications. This simple workflow can save time and help traders focus on price action and trade planning.
How Does a Fib Retracement Scanner Save Trading Time?
Manual chart analysis can take considerable time, especially when traders monitor several assets. A trader may need to open each chart, identify a significant swing high and swing low, draw Fibonacci levels, and then wait for price to approach an important zone.
A Fib retracement scanner Chrome solution can streamline much of this process. It can scan charts and identify potential Fibonacci-based setups according to predefined conditions.
This does not eliminate the need for analysis. Instead, it reduces repetitive work. Traders can spend more time evaluating market structure, volume, momentum, and risk rather than repeatedly drawing the same technical levels.
Can It Help Traders Scan Multiple Markets?
Yes. One of the biggest advantages of a Chart scanner for multiple markets is broader market coverage.
Modern traders may monitor cryptocurrencies, forex pairs, stocks, indices, and other instruments. Checking each market manually can become difficult as the watchlist grows.
A scanner can help organize this process by looking for potential Fibonacci retracement conditions across multiple instruments. Traders can then review the markets that meet their selected criteria.
For example, instead of opening dozens of charts, a trader could use a scanner to identify assets approaching a key retracement zone. This approach creates a more efficient workflow and can help traders discover opportunities they might otherwise overlook.
How Can Fibonacci Levels Improve Trade Planning?
Fibonacci retracement levels can provide a structured framework for analyzing pullbacks. When a market moves strongly in one direction, traders often look for a retracement before considering another potential move.
Levels such as 38.2%, 50%, and 61.8% can act as reference points during this analysis. A scanner can make these areas easier to identify.
However, traders should avoid treating Fibonacci levels as guaranteed reversal points. Price can move through any level without reacting. Stronger analysis comes from combining Fibonacci levels with other factors such as trend direction, support and resistance, candlestick behavior, and momentum.
Does a Chrome Scanner Make Market Analysis More Convenient?
A browser-based scanner offers convenience because Chrome is already part of many traders’ daily workflows. Traders can access their tools without installing complicated desktop software or maintaining multiple applications.
This convenience becomes particularly useful for traders who work across different devices or prefer browser-based platforms.
A well-designed scanner can provide a quick view of potential setups while keeping the analysis process organized. Traders can then open the relevant chart and perform deeper research before making a decision.
Can a Scanner Reduce Emotional Trading?
Emotions often influence trading decisions. Fear can cause traders to avoid valid setups, while excitement can encourage impulsive entries.
A scanner can support a more systematic approach by identifying opportunities according to predefined technical conditions. Instead of entering a trade simply because an asset is moving quickly, traders can wait for a setup that matches their strategy.
For example, a trader may decide to monitor assets near the 38.2% or 61.8% retracement level. The scanner can help identify potential candidates, while the trader remains responsible for confirming the setup.
This separation between scanning and decision-making can encourage better trading discipline.
What Role Does Automation Play in Fibonacci Scanning?
Automation can make technical screening more efficient. Rather than manually checking every chart, traders can allow scanning technology to perform repetitive searches based on selected conditions.
A tool such as Fibonacci Scanner can help traders locate potential Fibonacci setups and organize their market research. The goal is not to predict every price movement but to narrow a large market universe into a more manageable watchlist.
This can become especially valuable when market conditions change quickly. Traders can spend less time searching and more time evaluating the quality of each opportunity.
Can a Chart Scanner for Multiple Markets Help With Opportunity Discovery?
A Chart scanner for multiple markets can broaden the number of assets a trader can monitor. Different markets often move at different times, and a strong setup may appear in one asset while another remains inactive.
For instance, a forex trader may monitor major currency pairs, while a crypto trader may track dozens of digital assets. Manually analyzing every chart can make it difficult to maintain consistent coverage.
A scanner can flag markets that meet technical conditions. Traders can then prioritize those charts for further analysis.
This approach does not guarantee better trades, but it can improve the efficiency of the research process.
What Features Should Traders Look for in a Fib Retracement Scanner?
Not every scanner offers the same functionality. Traders should look for features that support their actual strategy.
Useful features may include:
- Automatic Fibonacci level detection
- Multiple timeframe scanning
- Support for several markets
- Customizable scanning conditions
- Clear setup alerts
- Fast chart access
- Easy-to-understand results
- Browser compatibility
- Non-repainting or stable signals where applicable
- Integration with broader technical analysis workflows
A simple interface also matters. If a scanner produces too much information, traders may struggle to identify the most relevant setups.
How Can Traders Combine Fibonacci Scanning With Other Indicators?
Fibonacci levels work best as part of a broader trading strategy. Traders can combine retracement zones with moving averages, trendlines, volume, momentum indicators, and established support or resistance.
For example, suppose price retraces toward the 61.8% Fibonacci level while also approaching previous support. A trader may consider this area more interesting than a Fibonacci level appearing in isolation.
Similarly, a bullish candlestick pattern near a retracement zone may provide additional confirmation.
The key principle is confluence. Multiple independent signals can create a stronger analytical case than one indicator alone.
Can a Fib Retracement Scanner Improve Risk Management?
A scanner cannot manage risk automatically unless it includes specific risk-management features, but it can support better planning.
Once a potential setup appears, traders can determine possible entry zones, invalidation levels, and profit targets. Fibonacci levels can provide reference points for this process.
For example, a trader might identify a retracement area and then define a stop-loss level beyond a recent swing point. The trader can also calculate the potential reward before entering the position.
This encourages traders to evaluate risk and reward rather than focusing only on potential profits.
Why Should Traders Use Fibonacci Scanner for a Structured Workflow?
A structured workflow can make technical analysis more consistent. Instead of randomly searching for trades, traders can follow a repeatable process:
- Scan multiple markets.
- Identify potential Fibonacci retracement setups.
- Open the strongest candidates.
- Confirm the broader trend.
- Check support and resistance.
- Review momentum and volume.
- Define entry and invalidation levels.
- Calculate potential risk and reward.
- Execute only when the setup meets the trading plan.
Fibonacci Scanner can become part of this process by helping traders handle the initial market-screening stage.
Is a Fib Retracement Scanner Suitable for Every Trader?
A Fibonacci scanner can benefit many technical traders, but it may not suit every strategy. Traders who rely primarily on fundamental analysis, long-term investing, or discretionary methods may find limited value in automated Fibonacci screening.
The tool works best when traders already understand how Fibonacci retracement levels function and have a clear strategy for evaluating setups.
New traders should also remember that a scanner is an analytical aid, not a guarantee of profitable trades. Market conditions can change rapidly, and technical signals can fail.
What Is the Overall Benefit of Using a Fib Retracement Scanner in Chrome?
The main benefit of using a Fib retracement scanner Chrome tool is efficiency. It can reduce repetitive chart work, help traders scan more markets, identify potential retracement zones, and create a more organized analysis process.
When combined with a Chart scanner for multiple markets, it can give traders a broader view of potential opportunities without requiring them to manually inspect every asset.
Ultimately, the scanner should support—not replace—sound trading decisions. Traders still need to confirm market structure, evaluate risk, and follow their trading plan. Used responsibly, a browser-based Fibonacci scanner can make technical market research faster, more systematic, and easier to manage.